- Home
- »
- Processed & Frozen Foods
- »
-
U.S. Flavors Market Size & Share, Industry Analysis Report, 2018-2025GVR Report cover
![U.S. Flavors Market Size, Share & Trends Report]()
U.S. Flavors Market Size, Share & Trends Analysis Report By Product (Liquid & Dry), By Application (Beverages, Bakery, Dairy, Processed Foods, Pet Food), And Segment Forecasts, 2018 - 2025
- Report ID: GVR-1-68038-984-5
- Number of Pages: 85
- Format: Electronic (PDF)
- Historical Range: 2014 - 2016
- Industry: Consumer Goods
Industry Insights
The U.S. flavors market size was valued at USD 3,970.9 million in 2016. Flavors are increasingly being incorporated into edible products such as baked food, beverages, and confectioneries to enhance their aroma & taste. Transitioning consumer tastes & growing inclination to experiment with new palettes & cuisines is also a key driving factor for the industry.
Dry flavors are relatively inexpensive to manufacture as compared to liquid products. The latter requires additional processing and additives for preparation, which contributes to higher production costs. However, processed food manufacturers prefer liquid additives for their taste consistency, secure production process, and sheer variety.
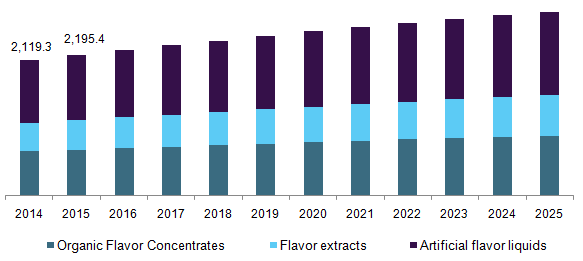
U.S. liquid flavors market revenue by product, 2014 - 2025 (USD Million)

Growing demand for ready-to-drink beverages and processed products owing to shortened meal preparation times in light of hectic consumer lifestyles has also driven industry growth. These additives are increasingly being incorporated into several consumer products to eliminate unwanted blandness, combat medicinal tastes of preservatives, and enhance overall product consistency.
Consumers in the U.S. are also increasingly being influenced by cuisine trends of Far eastern Asia, which has driven the demand for dry herbs & spices in regular meals. Companies are increasingly importing exotic & unique additives from emerging economies of China, India, Vietnam, and Malaysia among others, to meet transitioning consumer requirements.
Rising consumer awareness regarding the nutritional benefits of naturally derived products has contributed to the demand for organic concentrates extracted using organic farming processes. Organic food sales accounted for over 4.6% of overall U.S. sales in 2016. This demand is only set to rise as regulations pertaining to GMO and synthetically enhanced products are implemented in the U.S.
Low input costs owing to the elimination of pesticides and synthetic chemicals have encouraged several farmers to adopt organic farming techniques. Rising organic farming activities and agriculture in developing and developed economies is expected to complement organic liquid flavor concentrates market demand over the forecast period.
Product Insights
The liquid was the leading segment and accounted for over 56.9% of the overall revenue in 2014. These are further segmented into organic concentrates, flavor extracts, and artificial solutions, whereas dry products are categorized into dry spices & herbs and powdered products.
Liquids are increasingly being utilized across several end-use industries including beverages, bakery & confectionery, dairy & frozen, processed products, and others. High economic growth, rising disposable consumer income and subsequent demand for food & beverages are likely to contribute to high market growth in the Asia Pacific, North America, and other regions.
The increasing migration of the population from rural to urban and rising disposable income is increasingly being diverted into the food & beverage industry. Increasing consumer awareness regarding the nutritional benefits of naturally derived products has boosted demand for organic concentrates extracted from organic farming processes.
Dry additives are mostly utilized in beverages and processed products. High economic growth, rising disposable consumer income, and subsequent demand for food & beverages are likely to contribute to high market growth in the U.S.
The growing popularity of fruit juice and alcoholic drinks in the U.S. is expected to foster market development. The beer industry is flourishing in the U.S. and creating new avenues for powdered additives in the country. Various types of malts are used in the production of beer which encourages manufacturers to improve their offerings and manufacture new products.
Rising demand for dried fruit powder and dried fruit extracts is a primary driving force for dry additive consumption in the bakery industry. Bakery market is expected to benefit from rising demand for gluten-free biscuits, whole wheat bread, high-fiber cookies, and other healthy and nutritious products. Increasing consumer awareness regarding the detrimental impact of synthetic compounds and ingredients is anticipated to boost the flavors market share of dry additives in baked goods.
Application Insights
The industry has been segmented on the basis of application into beverages, bakery & confectionery, dairy & frozen, processed and others such as pet food, pharmaceuticals & nutraceuticals as well as tobacco products.
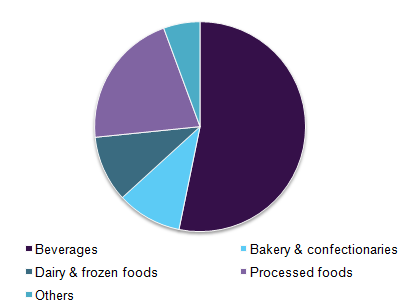
In 2016, beverages were the leading application and accounted for around 53% of the revenue. Increasing consumption of soft, carbonated, sports & energy, seasoned mineral water, and alcoholic drinks is expected to contribute to market growth.
Growing consumer demand for energy & sports, alcoholic, and refreshment drinks are also driving factors for industry expansion. However, market saturation and increasing competition by other applications in associated industries may challenge growth rates.
U.S. flavors market volume by application, 2016 (%)

Processed foods were one of the fastest-growing application segments as per recent market trends. The market is expected to benefit from the growing population and per capita income, coupled with increasing consumer preference for convenience or ready-to-eat goods. Rising investments by foreign multinationals in the market are likely to complement market growth as well.
Higher profit margins in the processed segment for retailers as compared to traditional foodstuffs are likely to foster market development. These food additives are increasingly being utilized in diverse processed products to restore nutrition and taste that depletes during high-temperature processing, packaging, and other operations.
U.S. Flavors Market Share Insights
The industry is highly competitive and relatively concentrated in the country, with the top four companies accounting for the maximum share of the production in 2016. Key market participants include Symrise AG, Frutarom Industries Ltd., Givaudan SA, and International Flavors & Fragrances Inc.
Application development and customized products are expected to be key parameters for gaining a competitive edge. Companies are thus engaging in numerous M&A in an attempt to diversify the product portfolio and gain market share.
Report Scope
Attribute
Details
Base year for estimation
2016
Actual estimates/Historical data
2014 - 2016
Forecast period
2017 - 2025
Market representation
Revenue in USD Million and CAGR from 2017 to 2025
Country scope
The U.S.
Report coverage
Revenue forecast, company share, competitive landscape, growth factors and trends
15% free customization scope (equivalent to 5 analyst working days)
If you need specific market information, which is not currently within the scope of the report, we Will provide it to you as a part of customization
Segments Covered in the ReportThis report forecasts revenue growth for the U.S. and provides an analysis of the industry trends in each of the sub-segments from 2014 to 2025. For the purpose of this study, Grand View Research has segmented the U.S. flavors market on the basis of product and application:
-
Product Outlook (Revenue, USD Million, 2014 - 2025)
-
Liquid
-
Organic Flavor Concentrates
-
Flavor extracts
-
Artificial flavor liquids
-
-
Dry
-
Dry Spices & Herbs
-
Powdered Flavors
-
-
-
Application Outlook (Revenue, USD Million, 2014 - 2025)
-
Beverages
-
Bakery & confectionaries
-
Dairy & frozen foods
-
Processed foods
-
Others (Pet Food, Pharmaceuticals, E-Cigarettes and Vapor Machines)
-
Share this report with your colleague or friend.
![gvr icn]()
NEED A CUSTOM REPORT?
We can customize every report - free of charge - including purchasing stand-alone sections or country-level reports, as well as offer affordable discounts for start-ups & universities. Contact us now
![ESOMAR Certified Member]()
![Great Place to Work Certified]()
ESOMAR & Great Work to Place Certified
![ISO 9001:2015 & 27001:2022 Certified]()
ISO 9001:2015 & 27001:2022 Certified
We are GDPR and CCPA compliant! Your transaction & personal information is safe and secure. For more details, please read our privacy policy.
We are committed towards customer satisfaction, and quality service.
"The quality of research they have done for us has been excellent."

Important: Covid19 pandemic market impact
The demand for packaged and processed foods is expected to increase owing to their longer shelf life. Furthermore, manufacturers are closely monitoring the product supply to major retailers through specialized communication channels in order to improve restocking. In addition, processed food manufacturers have urged the packaging raw material suppliers as well as contract packers to ensure a steady flow of goods during the lockdown related to COVID-19. The report will account for Covid19 as a key market contributor.


